October 2024
IPONZ continues to watch filing volumes closely. We have produced a number of graphs comparing last month’s activity to the month previous, and the same month in the previous year relying on the submission date.
Trade mark filing volumes
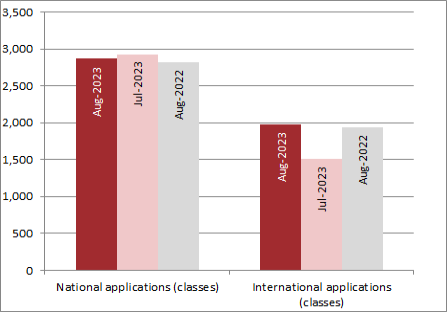
This graph of trade mark filing volumes shows the number of classes applied for on national applications was 2787 in the month of October, down from 3024 in the month earlier, compared with 2928 in the same month in last year. The number of classes applied for on international applications designating New Zealand was 2196 in the month of October, up from 1526 in the month earlier, compared with 1463 in the same month last year.
Trade mark filing volumes (New Zealand applicants)
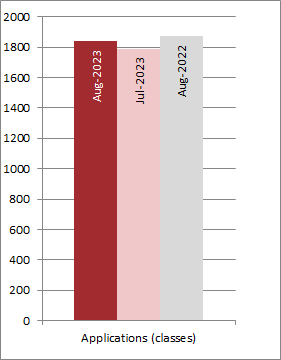
This graph of trade mark filing volumes applied for by New Zealanders shows the number of classes applied for was 1673 in the month of October, down from 1859 in the month earlier, compared with 1816 in the same month in last year.
Patent filing volumes

This graph of patent filing volumes shows the number of international applications received via the national phase of the Patent Cooperaton Treaty (PCT) was 331 in the month of October, down from 344 in the month earlier, compared with 426 in the same month in last year. The number of complete applications submitted was 123 in the month of October, up from 105 in the month earlier, compared with 100 in the same month last year.
The number of requests to examine patent applications received in the month of October was 434, up from 392 in the month earlier, compared with 398 in the same month in last year.
Patent filing volumes (New Zealand applicants)
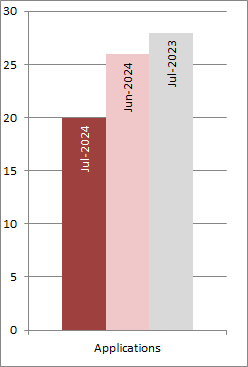
This graph of patent filing volumes applied for by New Zealanders shows that the number of complete patent applications applied for was 20 in the month of October, down from 22 in the month earlier, compared with 19 in the same month in last year.
Designs filing volumes

This graph of designs filing volumes shows that the number of designs applied for was 191 in the month of October, down from 198 in the month earlier, compared with 136 in the same month in last year.
Designs filing volumes (New Zealand applicants)
")
This graph of design filing volumes applied for by New Zealanders shows that the number of design applications applied for was 27 in the month of October, down from 39 in the month earlier, compared with 26 in the same month in last year.
Plant variety rights volumes
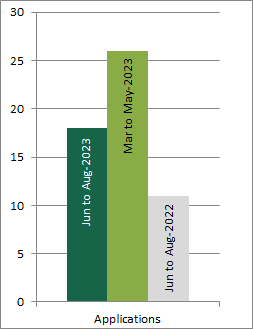
This graph of plant variety rights filing volumes shows that the number applied for was 19 in the period of three months to October, down from 24 in the three months prior to that, compared with 19 in the same three month period last year.
Application volumes - raw data
Application volumes for patents, trade marks, designs and plant variety rights since 2014 are available for download in the data sets below.
We want your feedback
We are considering improvements to this page. Please contact us regarding what other data fields and formats, over what time periods would be useful if provided regularly.
Requesting statistics
We can also provide other useful statistical data on request from our database. To make a request please use our online request service Please make your request as specific as possible to allow us to respond more quickly. We may contact you to clarify or refine your request.
Our data is also available via MBIE’s API services. The World Intellectual Property Organization’s Global Brands Database uses services like these for overnight updates to the New Zealand trade marks register data it uses.